Some amount of clicking lead me to a climate diatribe article that had a few good things in it:
1) mention of the statistic from the 2020 UN Emissions Gap Report that the average carbon footprint for each person per year should be <=2.1 tons of CO2-equivalent to achieve 1.5 degrees global warming. This mostly involves a drastic reduction of consumption by the top 20%, not the bottom 80%.
2) This handy chart:
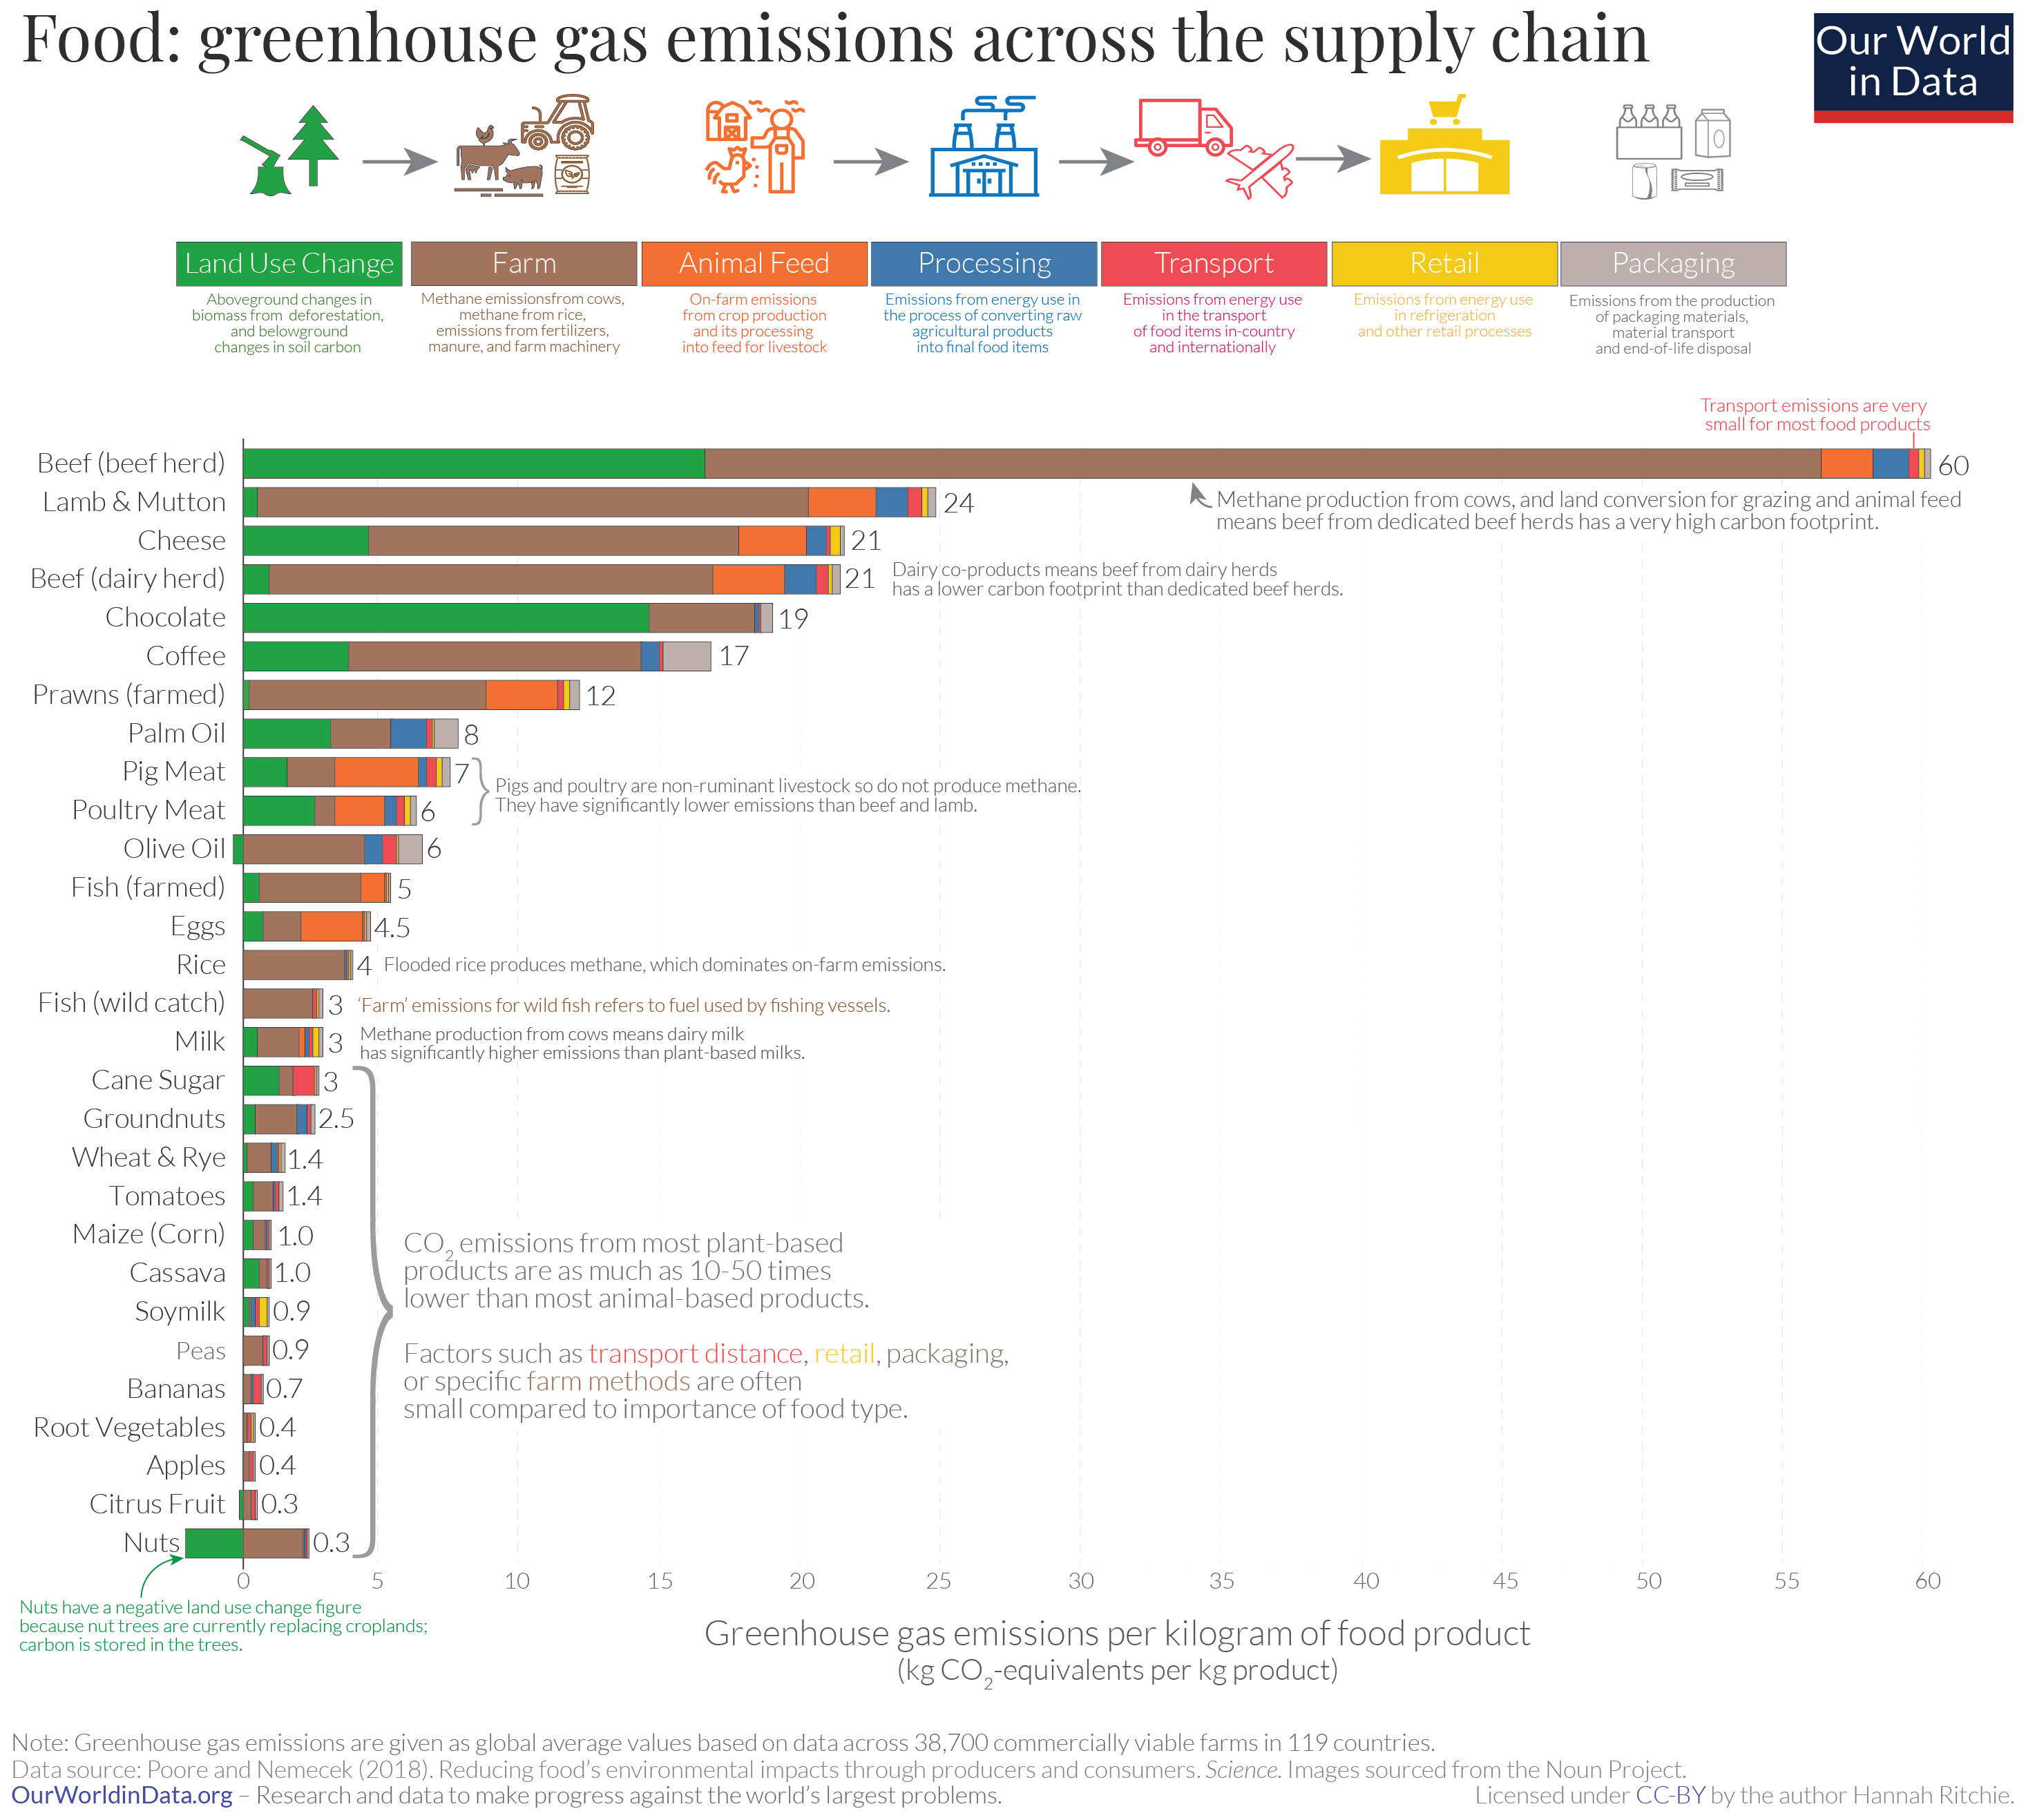
(from Environmental Impacts of Food Production, click to enbiggen)
Anyway, the chart is helpful in showing that:
- Yeah beef is bad, though cheese is less so
- pork is similar to chicken, so maybe it can be back on the menu!
- for some reason shrimp is twice as bad as fish?
- maybe Spouse and I can do a mutual goal to decrease our cheese/chocolate consumption
This also lead me on a search for carbon footprint calculators, and after getting numbers that varied between 1.8 tons - 8.3 tons for me as an individual*, it seems like there's the solid, easily-calculated numbers re: utilities, transit, and food. *Then* there's the sort of ¯\_(ツ)_/¯ numbers for "secondary spending", where you're asked to put in how much you spend on, say, your phone bill, and they magic a number for you. Bleh.
But hey, the former's not bad!
I think the Carbonfootprint.com calculator does a good job of providing the details for car and travel, though the EPA calculator is more straightforward for utilities. And then I just used the food chart to do a super rough estimate (estimated the number of lbs of chicken and cheese we eat per week, extrapolated that to per year, then multiplied by the corresponding number on the chart, then divided by 2000 to get the tonnage.)
So for our household:
- Utilities: 3 tons
- Transit: 1 ton
- Food: 1 ton
Total: 5 tons
Various carbon footprint checkers that disagree on secondary stuff seem to agree that we're operating at ~33% of local average, which is reassuring.
But then there's the "secondary" stuff. As in, the 5 tons does not account for, say, the lights at my workplace, or the extra energy that goes into the restaurant producing food for us to then buy and pick up. Our clothing purchases are so few that it's pretty negligible at an annual scale, and really my one major vice aside from getting take-out is getting Kickstarter gadgets.
There's really no point in trying to micro-analyze my secondary spending, especially since none of the carbon footprint calculators seem to agree on what the actual CO2e tonnage would be, not even a ballpark.
Maybe what would make more sense for me is to come up with a sort of reasonable multiplier, as such:
- Utilities: Add 10% for every day at the office per person. (Add only 5% if office is low-energy-use).
- Transit: Add 20% if you get deliveries ~1x per week, 40% if you get deliveries ~2x per week.
- Food: Eating out is double the cost of eating in, so add % equivalent to how much you eat out. (Add only half % if restaurants are low-energy-use)
So by that count, my data would be:
- Utilities: 3.6 tons
- Transit: 1.3 tons
- Food: 1.4 tons
Total: 6.3 tons
I'm going to round that up to 7 tons for all the other stuff that I'm not accounting for.
For my household of 3, that divides down to 2.3 tons per person.
---------
*I actually calculated household numbers, but did a simple division for the ease of comparison to the 2.1 ton number.
1) mention of the statistic from the 2020 UN Emissions Gap Report that the average carbon footprint for each person per year should be <=2.1 tons of CO2-equivalent to achieve 1.5 degrees global warming. This mostly involves a drastic reduction of consumption by the top 20%, not the bottom 80%.
2) This handy chart:
(from Environmental Impacts of Food Production, click to enbiggen)
Anyway, the chart is helpful in showing that:
- Yeah beef is bad, though cheese is less so
- pork is similar to chicken, so maybe it can be back on the menu!
- for some reason shrimp is twice as bad as fish?
- maybe Spouse and I can do a mutual goal to decrease our cheese/chocolate consumption
This also lead me on a search for carbon footprint calculators, and after getting numbers that varied between 1.8 tons - 8.3 tons for me as an individual*, it seems like there's the solid, easily-calculated numbers re: utilities, transit, and food. *Then* there's the sort of ¯\_(ツ)_/¯ numbers for "secondary spending", where you're asked to put in how much you spend on, say, your phone bill, and they magic a number for you. Bleh.
But hey, the former's not bad!
I think the Carbonfootprint.com calculator does a good job of providing the details for car and travel, though the EPA calculator is more straightforward for utilities. And then I just used the food chart to do a super rough estimate (estimated the number of lbs of chicken and cheese we eat per week, extrapolated that to per year, then multiplied by the corresponding number on the chart, then divided by 2000 to get the tonnage.)
So for our household:
- Utilities: 3 tons
- Transit: 1 ton
- Food: 1 ton
Total: 5 tons
Various carbon footprint checkers that disagree on secondary stuff seem to agree that we're operating at ~33% of local average, which is reassuring.
But then there's the "secondary" stuff. As in, the 5 tons does not account for, say, the lights at my workplace, or the extra energy that goes into the restaurant producing food for us to then buy and pick up. Our clothing purchases are so few that it's pretty negligible at an annual scale, and really my one major vice aside from getting take-out is getting Kickstarter gadgets.
There's really no point in trying to micro-analyze my secondary spending, especially since none of the carbon footprint calculators seem to agree on what the actual CO2e tonnage would be, not even a ballpark.
Maybe what would make more sense for me is to come up with a sort of reasonable multiplier, as such:
- Utilities: Add 10% for every day at the office per person. (Add only 5% if office is low-energy-use).
- Transit: Add 20% if you get deliveries ~1x per week, 40% if you get deliveries ~2x per week.
- Food: Eating out is double the cost of eating in, so add % equivalent to how much you eat out. (Add only half % if restaurants are low-energy-use)
So by that count, my data would be:
- Utilities: 3.6 tons
- Transit: 1.3 tons
- Food: 1.4 tons
Total: 6.3 tons
I'm going to round that up to 7 tons for all the other stuff that I'm not accounting for.
For my household of 3, that divides down to 2.3 tons per person.
---------
*I actually calculated household numbers, but did a simple division for the ease of comparison to the 2.1 ton number.